Housing Insecurity
Housing insecurity is an umbrella term that encompasses a variety of circumstances and indicates risks to attaining and maintaining safe and stable housing. Affordable housing, or housing that costs less than 30% of household income, including utilities, is key to stable housing. Many communities use data points to understand the availability and health of area housing. The maps below are county-by-county numbers for some of those metrics and indicators.
More housing resources are listed below for further investigation. You can download the full Idaho at a Glance with the link above.
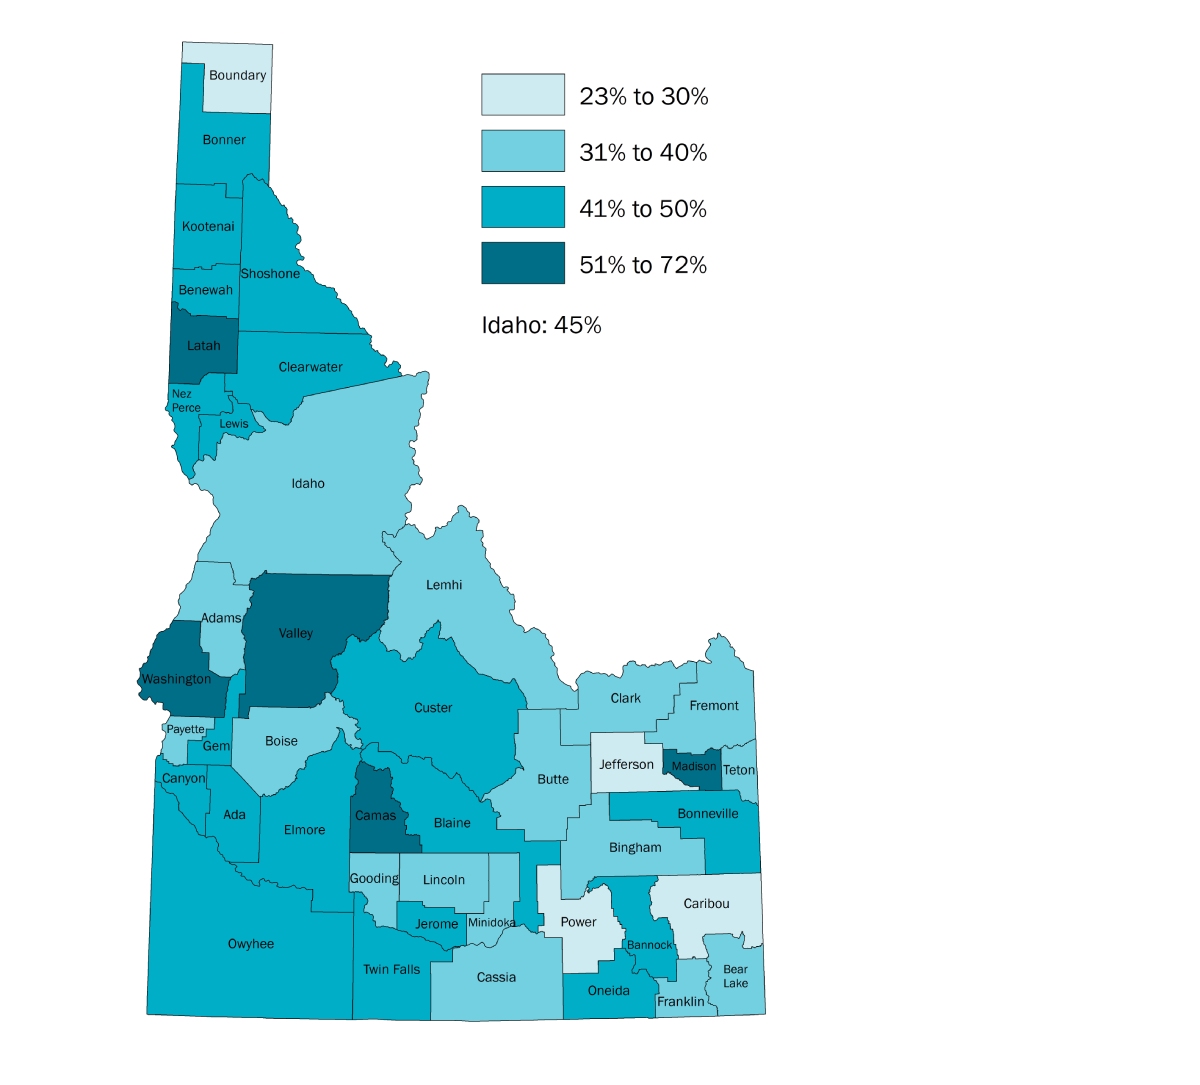
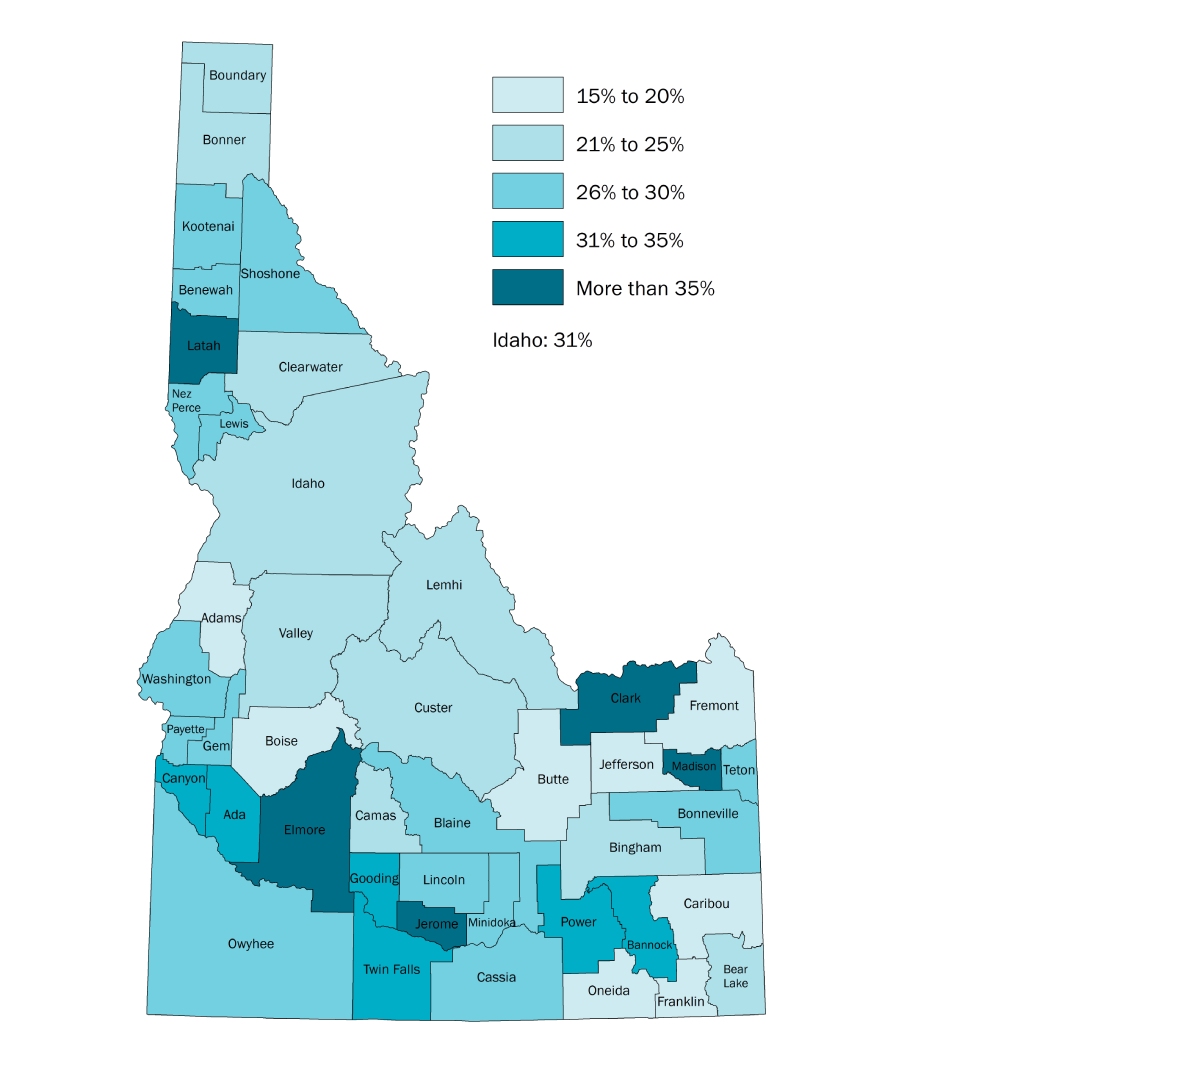
Percentage of cost burdened and severely cost burdened renters (2018)
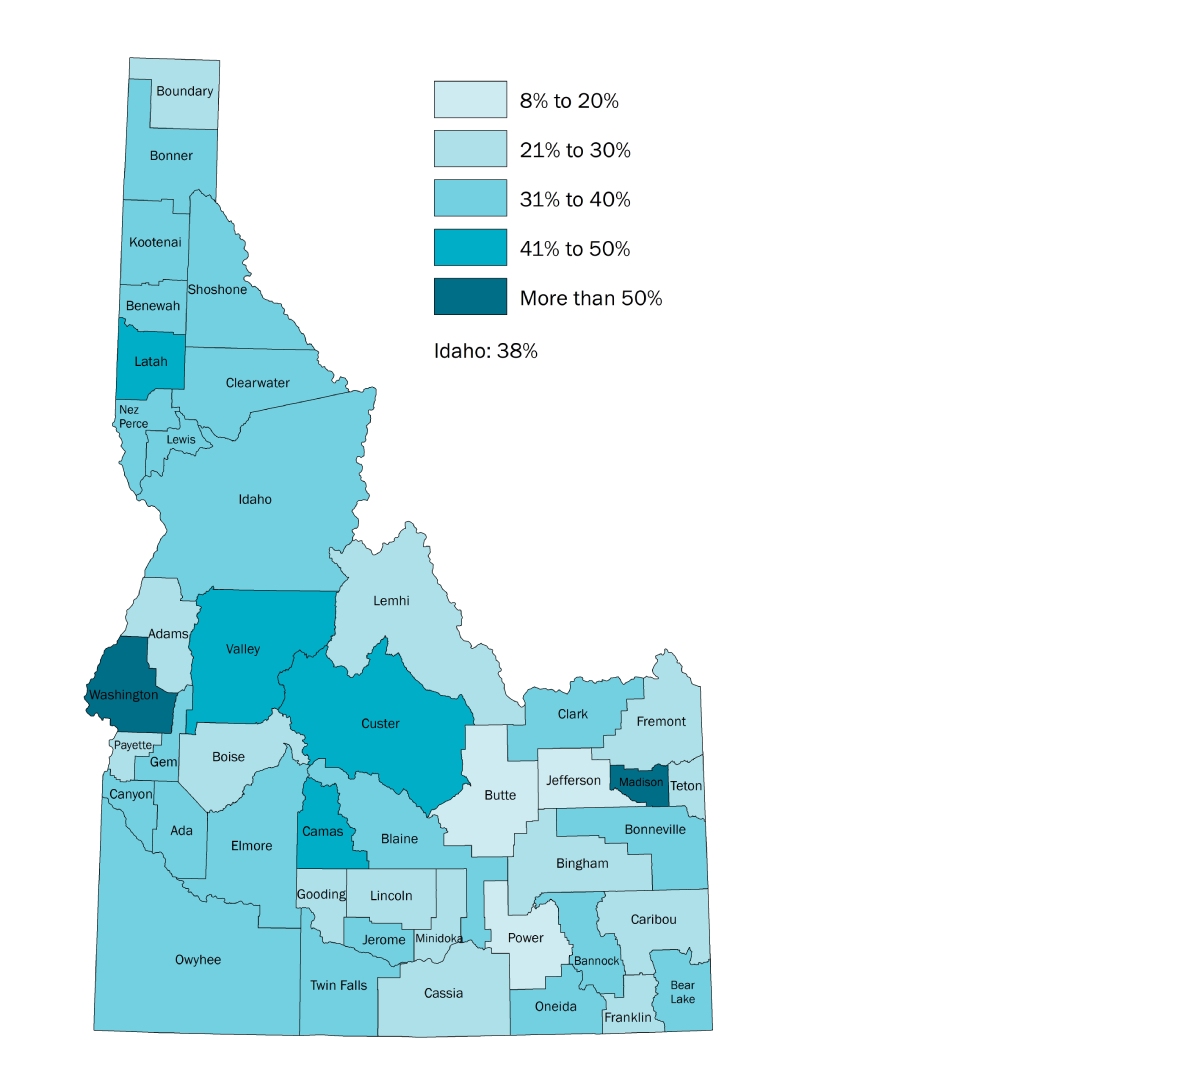
View Full MapPercentage of cost burdened renters (2018)
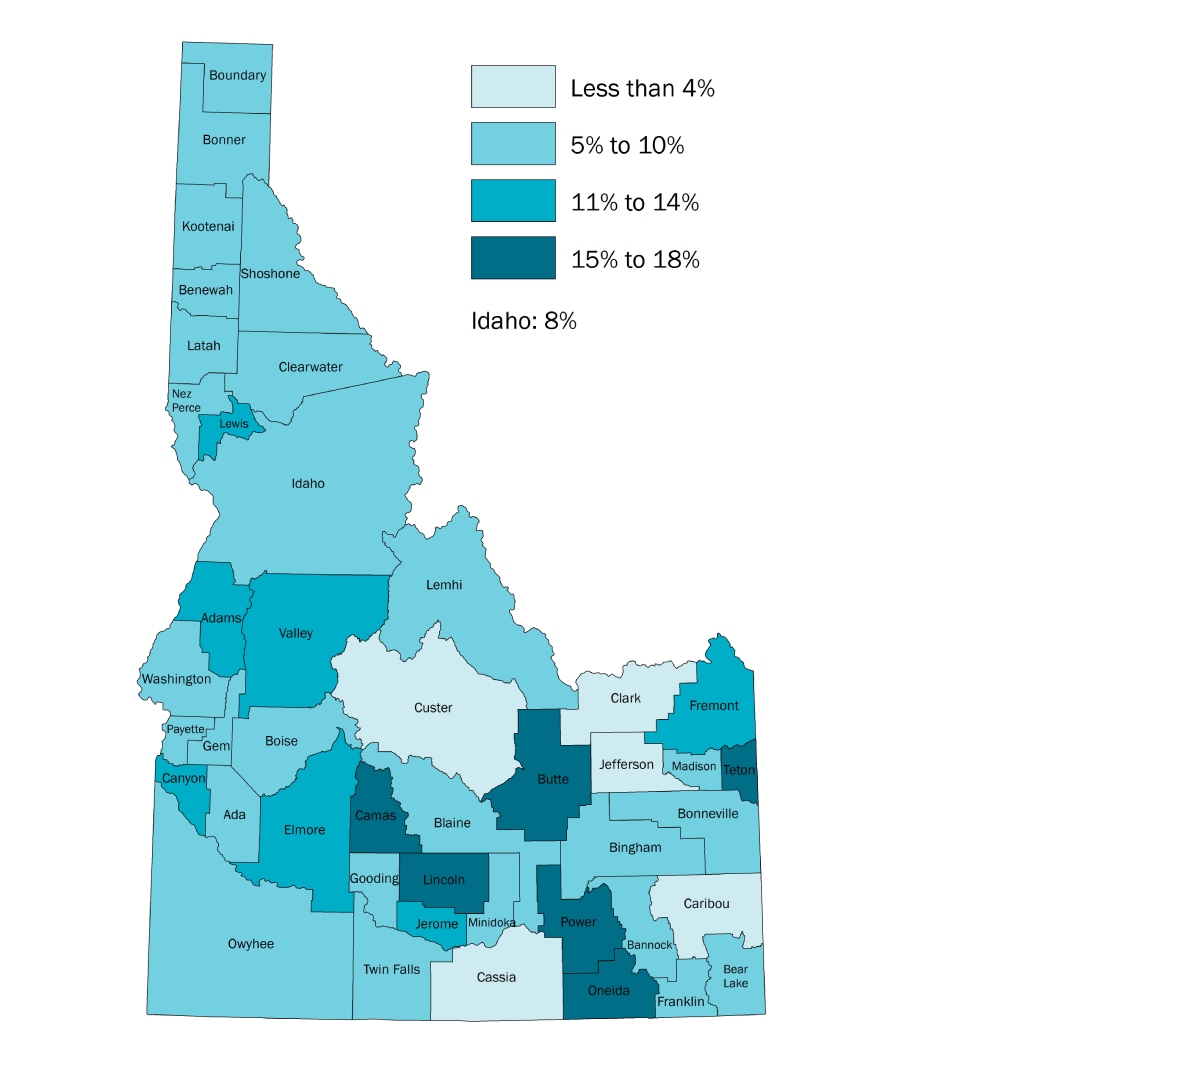
View Full MapPercentage of severely cost burdened renters (2018)
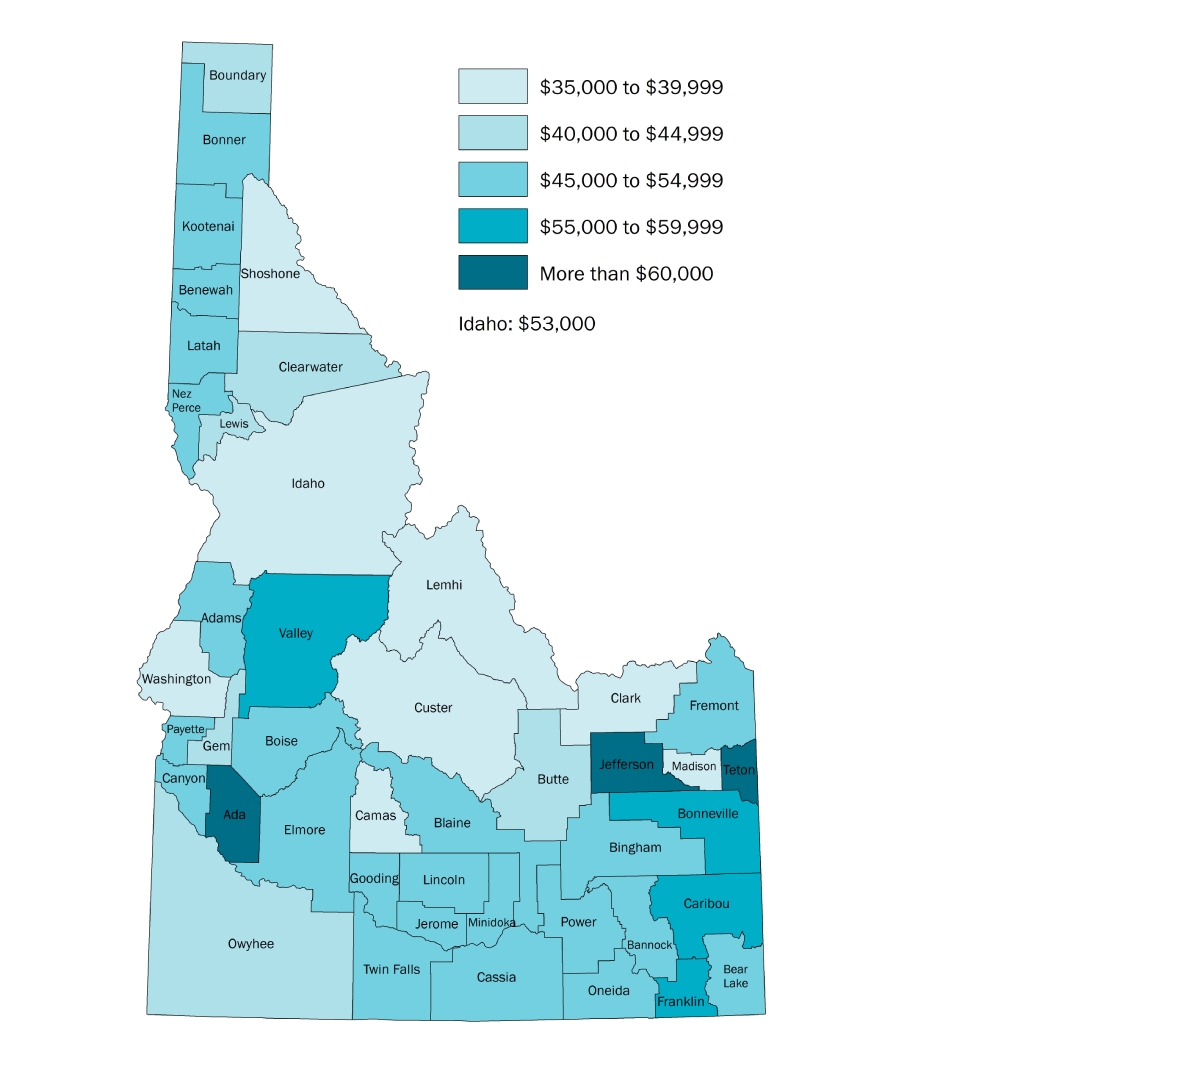
View Full MapMedian annual income (2018)
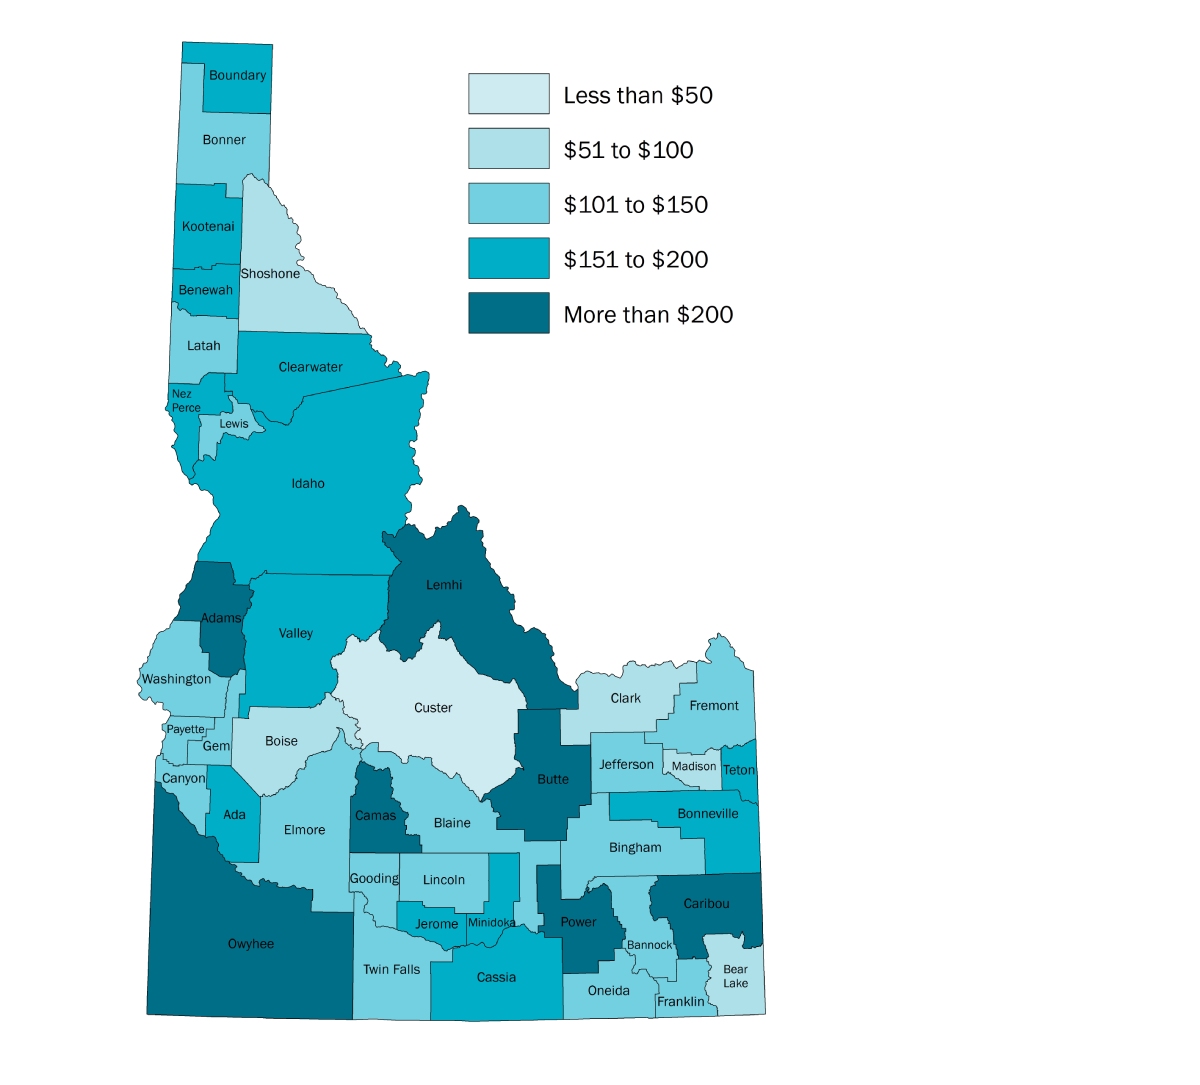
View Full MapChange in average weekly wage (from 2010 to 2019)
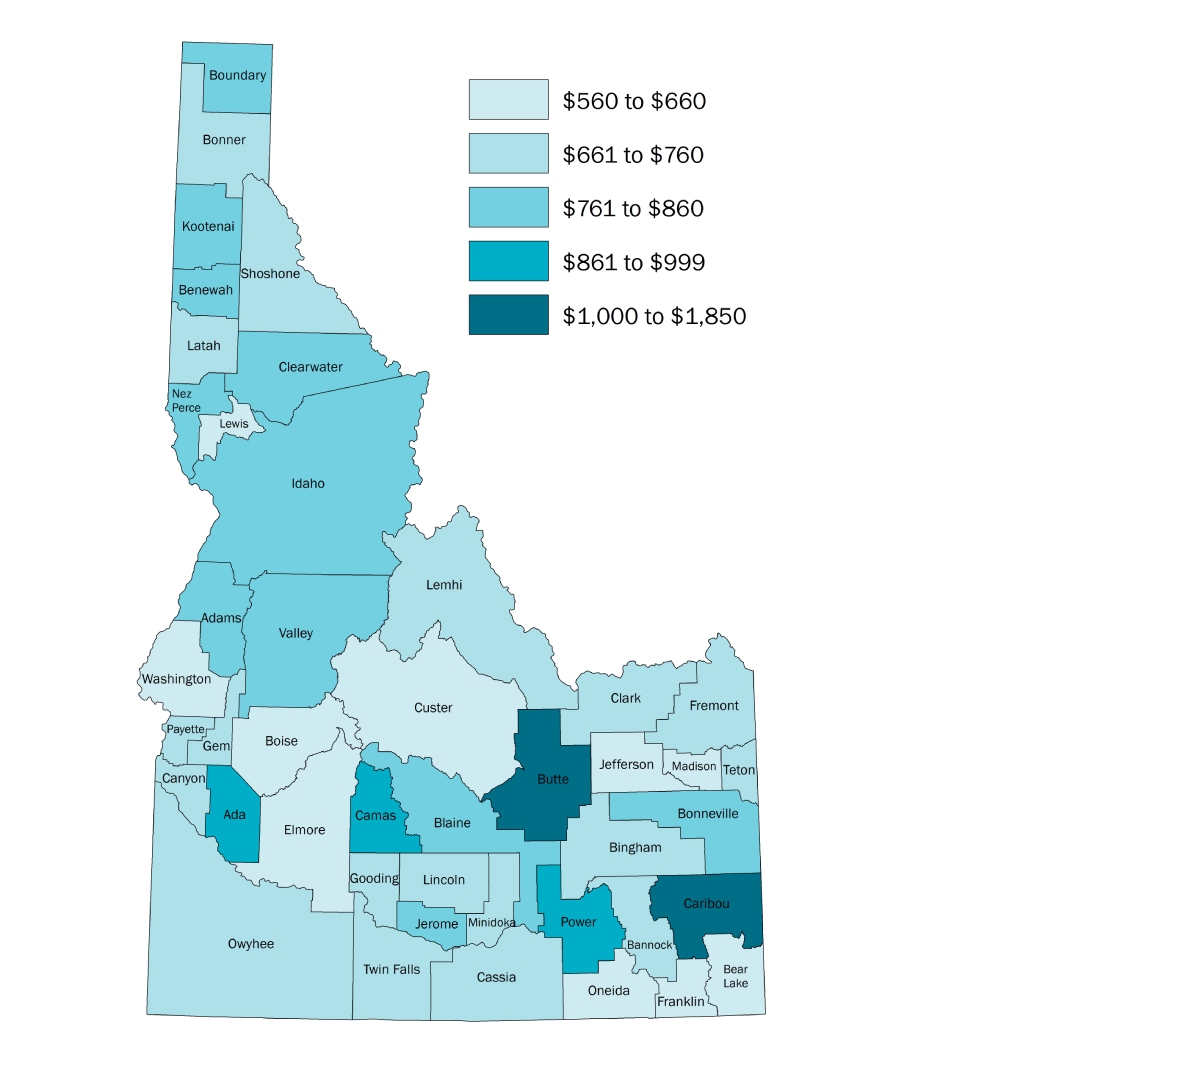
View Full MapAverage weekly wage (Quarter 3, 2019)
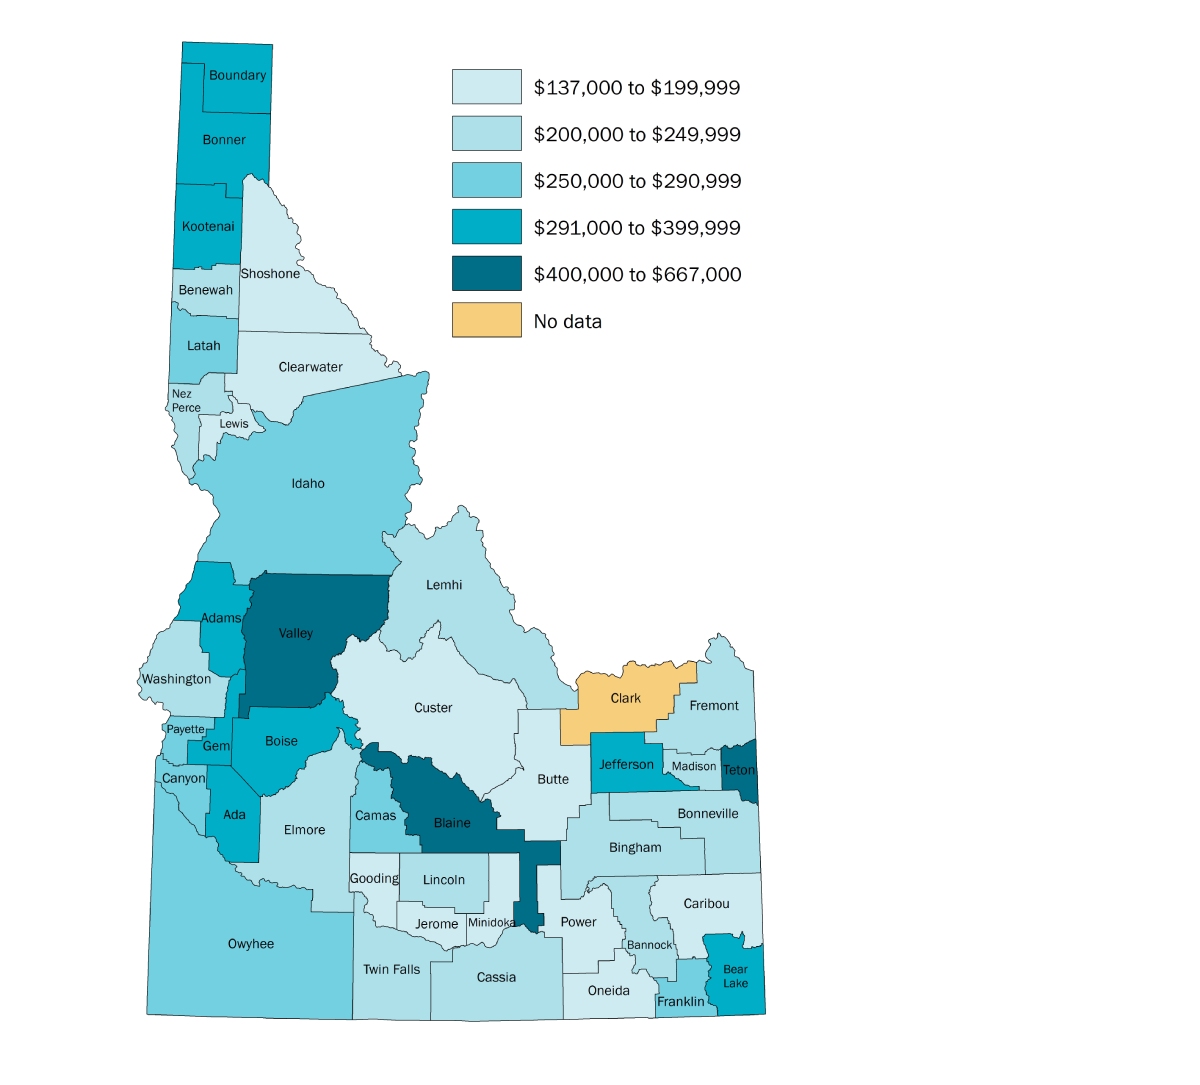
View Full MapMedian house price (Feb. 25, 2020)
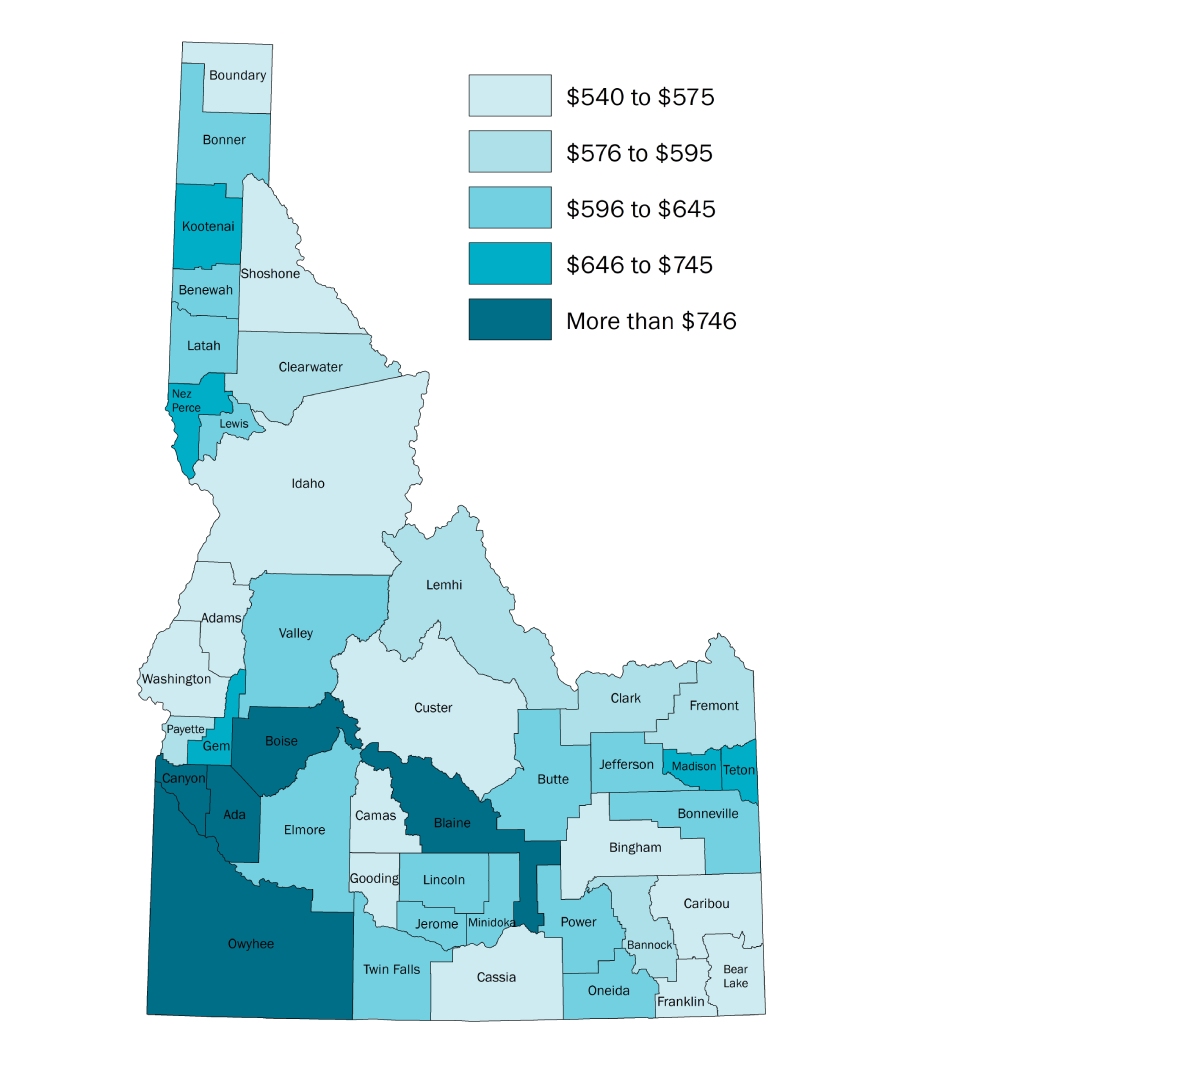
View Full MapFair market rent rate – one bedroom (2020)
View Full MapPercentage of renters (2018)
View Full MapPercentage of homeowners (2018)
View Full MapIncrease in housing units (from 2010 to 2018)
View Full MapChange in population (from 2010 to 2018)
View Full MapPopulation (2018)
View Full MapMAPS BY: Tenley Burke, M.S., Research Associate, University of Idaho College of Agricultural and Life Sciences, Office of Grant and Project Development
Additional resources and data that provide information about housing insecurity in Idaho:
Percentage of cost burdened and severely cost burdened renters (2018)

County-by-county data retrieved from US Census Bureau, American Community Survey 2014-2018 program table DP04 and can be explored further at data.census.gov
Households that spend more than 30% of their income on housing, including utilities, are defined as cost burdened. If a household pays more than 50% of income on housing and utilities, then they are severely cost burdened.1
Housing that costs less than 30% of household income, including utilities, is considered affordable housing.2
Return to the top of the page.
Percentage of cost burdened renters (2018)

County-by-county data retrieved from the US Census Bureau, American Community Survey 2014-2018 program table DP04 and can be explored further at data.census.gov
Households that spend more than 30% of their income on housing, including utilities, are defined as cost burdened.3
Return to the top of the page.
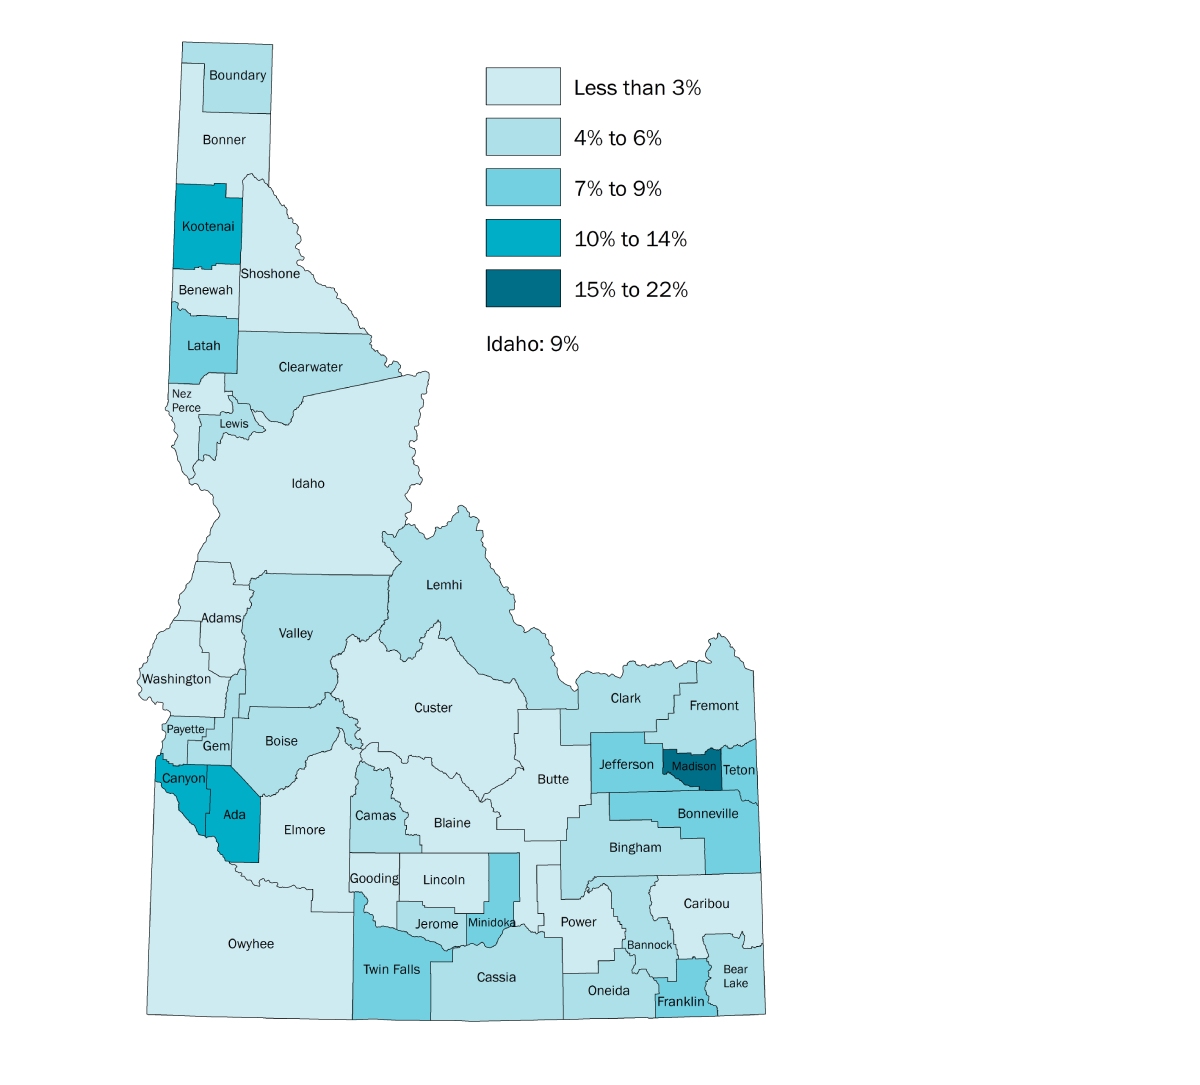
Percentage of severely cost burdened renters (2018)

County-by-county data retrieved from the US Census Bureau, American Community Survey 2014-2018 program table DP04 and can be explored further at data.census.gov
Households that spend more than 50% of their income on housing, including utilities, are defined as severely cost burdened.4
Return to the top of the page.
Median annual income (2018)

County-by-county data retrieved from the US Census Bureau, American Community Survey 2014-2018 program table S2503 and can be explored further at data.census.gov
Return to the top of the page.
Change in average weekly wage (from 2010 to 2019)

County-by-county data retrieved from the US Bureau of Labor Statistics, Pay and Wages and can be explored further at bls.gov/bls/proghome.htm#wages
The calculation for the change in weekly wage by county compares Q3 in 2010 and Q3 in 2019. The map shows the net increase in wages for each county as a whole dollar amount.
Return to the top of the page.
Average weekly wage (Quarter 3, 2019)

County-by-county data retrieved from the US Bureau of Labor Statistics, Pay and Wages and can be explored further at bls.gov/bls/proghome.htm#wages
Return to the top of the page.
Median house price (Feb. 25, 2020)

County-by-county data retrieved from Realtor.com, Current Home Values and Listing Prices and can be explored further at realtor.com/realestateandhomes-search/Idaho
Return to the top of the page.
Fair market rent rate – one bedroom (2020)

County-by-county data retrieved from the US Department of Housing and Urban Development (HUD), Fair Market Rent. Additional units can be explored further at huduser.gov/portal/home.html
Fair market rental rate is defined by HUD as the 40th percentile of rental rates for typical units.5
Return to the top of the page.
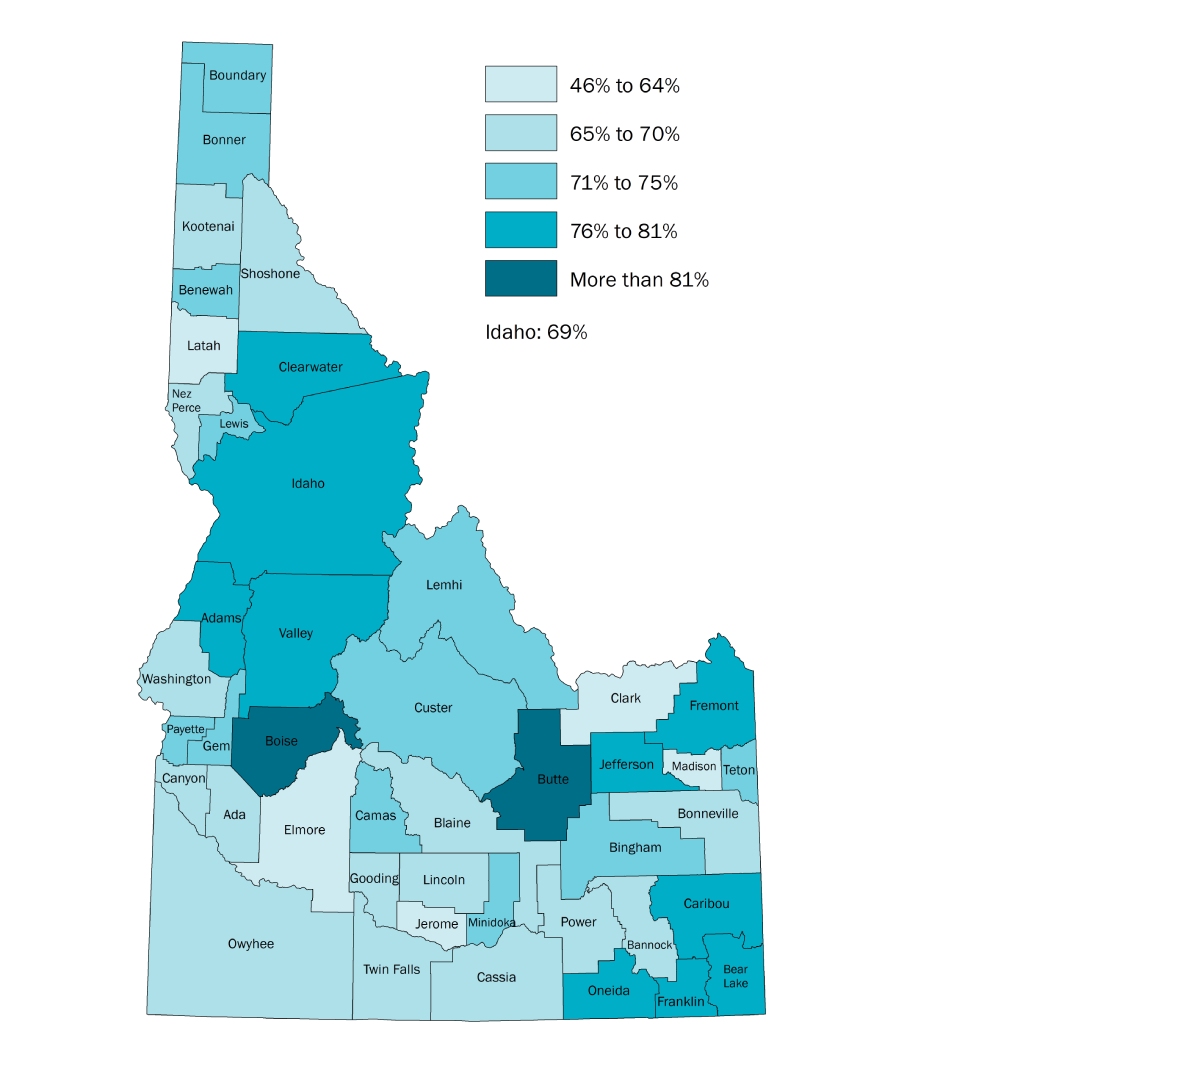
Percentage of renters (2018)

County-by-county data retrieved from the US Census Bureau, American Community Survey 2014-2018 program table S2503 and can be explored further at data.census.gov
Return to the top of the page.
Percentage of homeowners (2018)

County-by-county data retrieved from the US Census Bureau, American Community Survey 2014-2018 program table S2503 and can be explored further at data.census.gov
Return to the top of the page.
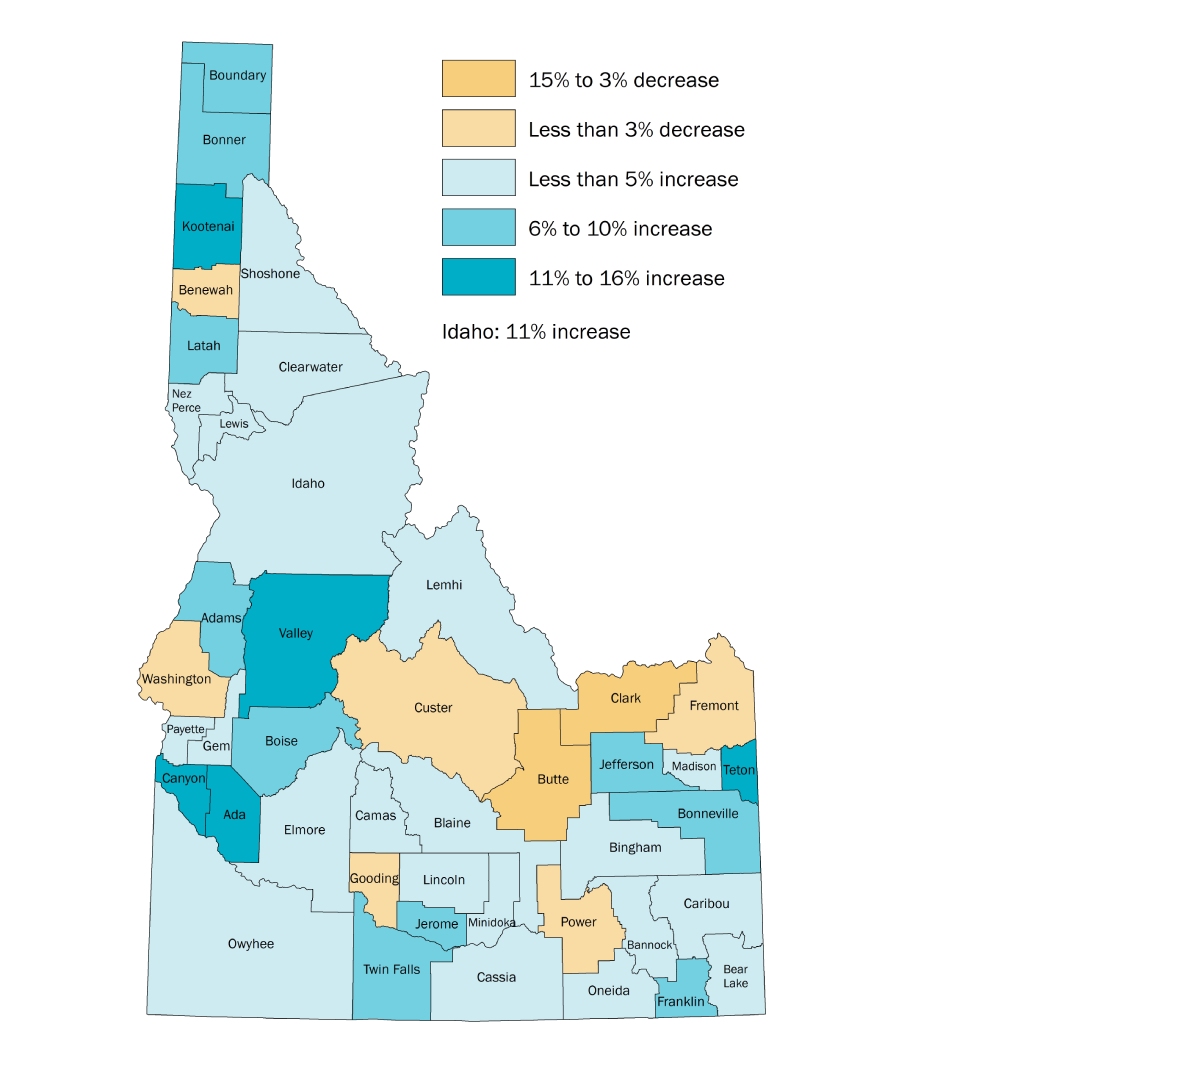
Increase in housing units (from 2010 to 2018)

County-by-county data retrieved from the US Census Bureau, Population Estimate program table PEPANNRES and can be explored further at data.census.gov
Housing units are defined by the US Census Bureau as “a house, an apartment, a group of rooms, or a single room occupied or intended for occupancy as separate living quarters”.6
Return to the top of the page..
Change in population (from 2010 to 2018)

County-by-county data retrieved from the US Census Bureau, Population Estimate program table PEPANNRES and can be explored further at data.census.gov
Return to the top of the page..
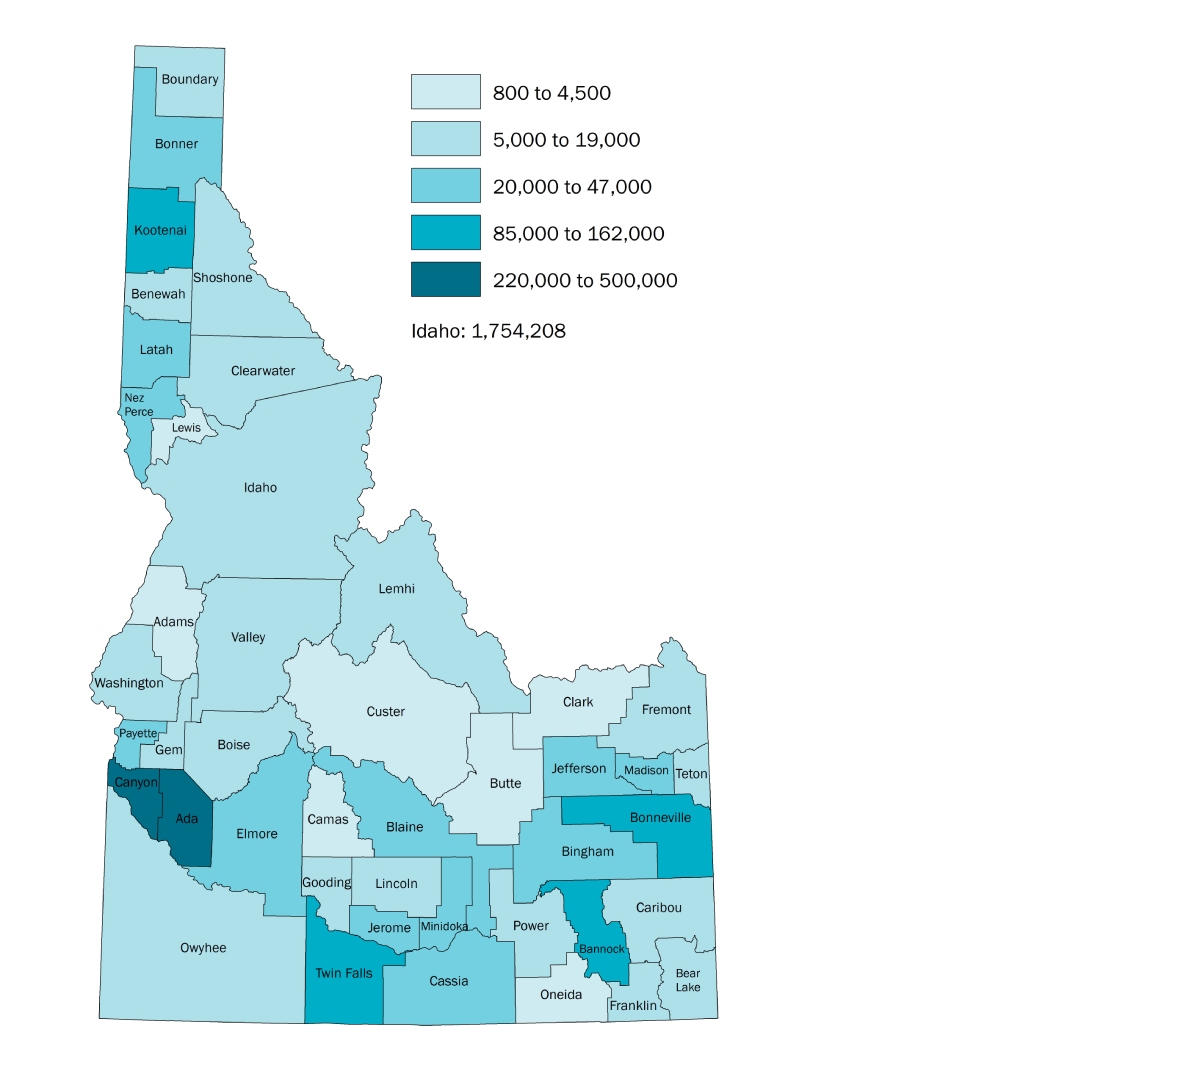
Population (2018)

County-by-county data retrieved from the US Census Bureau, Population Estimate program table PEPANNRES and can be explored further at data.census.gov
*Note: In 2018, there were no counties with a reported population between 47,100 and 84,999, nor any with a reported population between 162,100 and 219,999.
Return to the top of the page.


